
Data quality is crucial for success in the world of clinical trials, where accuracy and reliability are crucial. Data quality metrics serve as a guiding light, aiding scientists, physicians, and other stakeholders in making informed decisions and pioneering advancements in research. Poor data quality can lead to inaccurate results, which can have serious consequences for patients and the development of new drugs and therapies.
A Window into Data Integrity:
Data Accuracy Metrics are the watchful defenders of data integrity. They include a variety of measurable indicators that examine trial data’s quality, completeness, consistency, and dependability. These metrics provide a comprehensive perspective of data quality, guaranteeing that the information gathered is not only credible but also follows regulatory requirements.
Unraveling the Impact:
The consequences of comprehensive Data Quality Metrics go far beyond data sheets. These measurements serve as sentinels in the complicated landscape of clinical trials, detecting anomalies and irregularities early on. They enable researchers to take corrective actions quickly by spotting anomalies, outliers, and errors, preserving the credibility and validity of trial results.
Empowering Informed Decision-Making:
Informed judgments are based on accurate and trustworthy data. Data Quality Metrics enable researchers and clinicians to make confident data-driven decisions.
Amplifying Regulatory Compliance:
Navigating the complex regulatory environment of clinical research is a time-consuming task. Data Quality Metrics provides a practical means to demonstrate regulatory compliance.
Metrics to Measure Data Quality
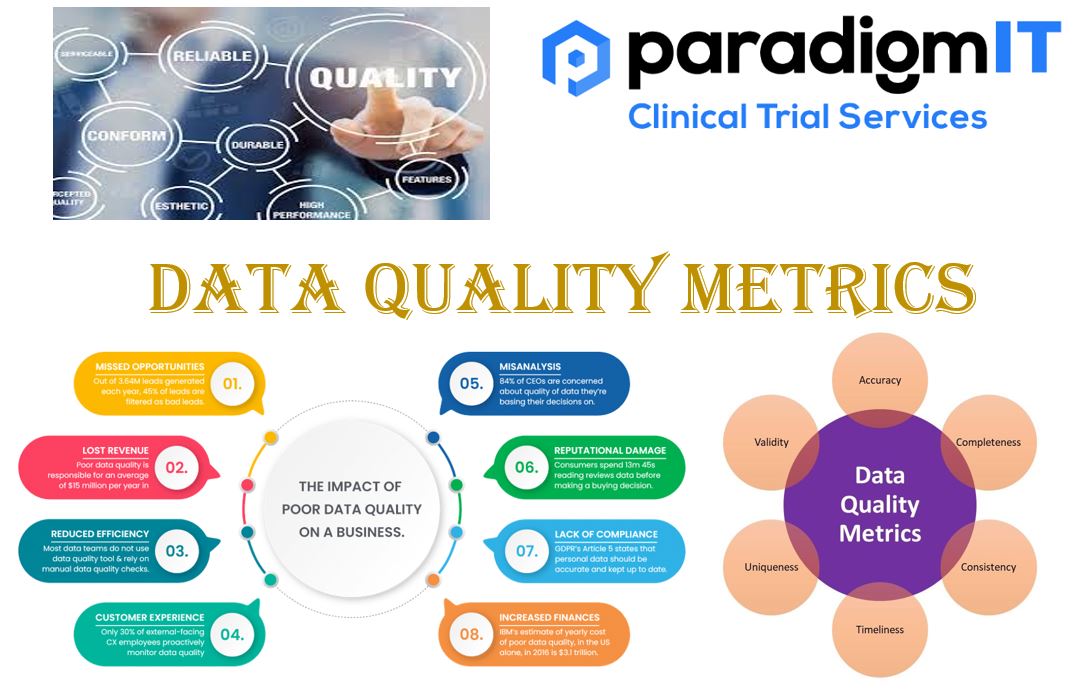
Several data quality metrics can be used to assess the quality of data in clinical trials. Some of the most important metrics include:
- Accuracy: The accuracy of data refers to how closely it reflects reality. This can be assessed by comparing data to a gold standard, such as a physical measurement or a laboratory test. For example: The primary and secondary endpoints are being source verified to assure the information in EDC is accurate.
- Completeness: The completeness of data refers to how much of the data is present. This can be assessed by calculating the percentage of data that is missing or incomplete. For example: Number of mandatory datapoints per visit/per patient expected versus completed for having a successful trial.
- Consistency: The consistency of data refers to how well it agrees with itself. This can be assessed by looking for inconsistencies in data values, such as duplicate records or illogical entries. For example: Samples of patient for a region are picked to see if the datapoints are filled in consistently or if there is any ambiguity in understanding the data required versus filled in.
- Timeliness: The timeliness of data refers to how quickly it is collected and entered in the database. This is important for ensuring that data is accurate and up to date. For example: Reports/dashboards showing up site data entry TAT (or) Adverse event reports are submitted in a timely manner to regulatory authorities to ensure patient safety and compliance with regulatory requirements.
- Relevance: The relevance of data refers to how important it is to the clinical trial. This can be assessed by looking at the data elements that are required by the study protocol. For example: Number of Protocol deviations reported for the study at any given point in time (or) Collection of relevant data i.e., blood sugar levels, insulin usage, and patient responses to the medication in a diabetes medication study is highly relevant to the trial’s objectives.
- Error Ratio: It allows you to track how the number of known errors – such as missing, incomplete, or redundant entries – within a data set corresponds to the size of the data set. If you find fewer errors while the size of your data stays the same or grows, you know that your data quality is improving. For example: If a clinical database initially contained 20 missing records of adverse events out of 150 patient cases, the error ratio for adverse event reporting was 13.3%. Over a time, if the missing records are 30 out of 300 patient cases, the error ratio would be 10% which shows data quality is improving.
- Uniqueness: Uniqueness is the most critical dimension for ensuring no duplication or overlaps. Data uniqueness is measured against all records within a data set or across data sets. A high uniqueness score assures minimized duplicates or overlaps, building trust in data and analysis. For example: Uniqueness of LAB IDs guarantees that no two patients share the same test identification number, which is essential for accurate tracking of test results and patient care.
Impacts of Poor Quality Data:
Having poor-quality data can make it difficult to conclude the clinical trial with meaningful data. It also makes it difficult to conduct long-term planning, as your decisions can be based on bad data.
- Waste of resources
- Costs them money
- Damages the quality of their analytics
- Leads to incorrect Report and Decisions
- Negative impact on the customer experience
- Delay in result trial submission
- Hinders compliance with government and industry regulations
In the pursuit of medical breakthroughs, the importance of Data Quality Metrics cannot be overstated. These metrics uphold the fundamental tenets of clinical research by safeguarding data integrity, empowering informed decisions, and propelling scientific advancement. As we forge ahead in the realm of clinical trials, embracing Data Quality Metrics isn’t just a best practice—it’s an imperative step towards a future where healthcare innovation knows no bounds.
For more information –
Visit our website – www.paradigmit.com
Or you can write us at ask@paradigmit.com
Follow us for more – https://www.linkedin.com/company/paradigmittechnologyservices/?viewAsMember=true