
Understanding and deciphering clinical trial findings can be a complex challenge for the unprepared. With increasing data points, it is imperative to find better ways of data management and data analysis. To gain valuable insights from the available trial data, researchers may need to use the latest techniques and technologies in data visualization. Such techniques help in real-time analysis and optimal use of available resources. The results in visual format offer a holistic overview of the clinical trial findings and provide related action points.
The importance of data visualization is more clearly understood when handling multi-dimensional clinical trial data. For instance, studies have shown that reporting adverse events in clinical trials through data visualization methods can reduce bias by providing a complete overview of adverse reactions and their related factors. Data visualization in multi-centric trials can be handy to compare the overall study population with a defined benchmark or study the progression of the subject’s clinical data over a pre-defined period.
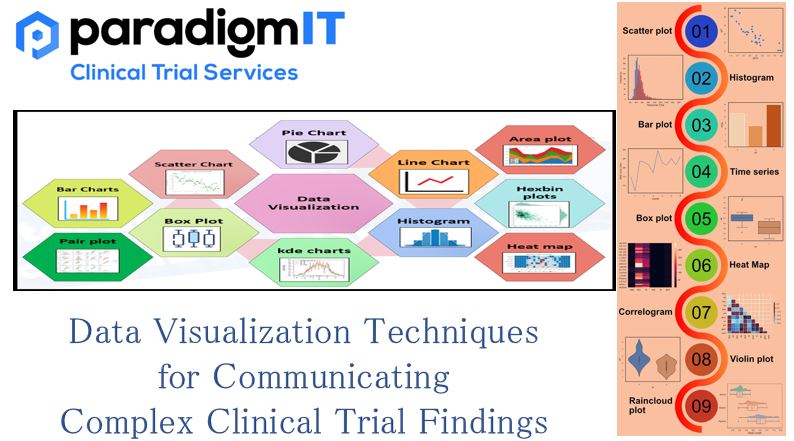
Here are some data visualization techniques detailed:
- Graphs and Charts:
- Line Graphs: Use these to track changes over time, such as the progression of treatment effects or adverse events.
- Bar Charts: Compare categorical data, like treatment groups, outcomes, or patient demographics.
- Pie Charts: Display proportions or percentages, such as the distribution of adverse events by severity.
- Histograms: Depict frequency distributions of continuous variables, such as patient age or laboratory measurements.
- Box Plots: Show the distribution and variability of data, useful for comparing treatment groups or displaying outliers.
- Heatmaps: Use heatmaps to illustrate patterns or relationships among variables. For example, you could create a heatmap to show how different treatments affect various clinical endpoints over time.
- Sankey Diagrams: Offers a visual narrative of patient progression through different stages of a clinical trial, including enrolment, treatment, and outcomes.
- Forest Plots: Forest plots are useful for presenting meta-analyses or summaries of multiple studies. They allow you to display individual study results along with a combined summary estimate.
- Bubble Charts: Use bubble charts to display three-dimensional data, such as comparing treatment effects based on multiple endpoints.
- Interactive Dashboards: Create interactive dashboards using tools like Tableau or Power BI. This allows users to explore trial data and findings in a dynamic and customizable way.
- Infographics: Create visually appealing infographics that summarize key findings, treatment effects, and safety data. Infographics can simplify complex information for a wider audience.
Key principles when designing data visualizations:
- Clarity: Keep visualizations simple, avoiding unnecessary clutter or distractions.
- Accuracy: Ensure accurate representation of data, including appropriate scaling, labelling, and axis values.
- Consistency: Maintain consistent colour schemes, fonts, and design elements throughout your visualizations.
- Interactivity: If possible, allow users to interact with the visualizations to explore data further.
- Audience-Centric: Tailor your visualizations to your target audience’s level of understanding and familiarity with clinical trial concepts.
It’s important to remember that data visualization may require an investment of high resources up-front. But it will produce long-term dividends in terms of better clinical trial efficiency. With the increasing decentralization of clinical trials, data visualization is becoming an inevitable part of complex clinical trials. It improves the overall operational efficiency and increases the potential for the commercial success of clinical trials.
For more information –
Visit our website – www.paradigmit.com
Or you can write us at ask@paradigmit.com
Follow us for more – https://www.linkedin.com/company/paradigmittechnologyservices/?viewAsMember=true