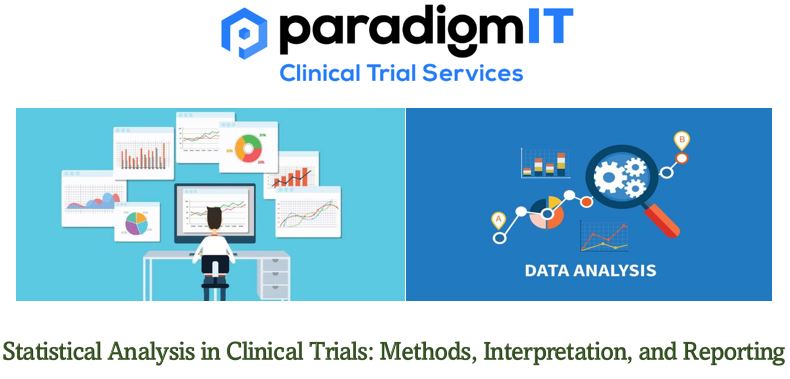
Statistics and clinical research go hand in hand. Without adequate statistical support as a backbone, clinical trials will fail to deliver the expected results for far-fetched medical applications. Diligent efforts in statistical analysis will help researchers avoid common biases in clinical trials and translate the data sets into evidence for clinical decision-making. Statistical analysis, conducted in a non-arbitrary and scientific method, can yield meaningful inferences. we will explore the key aspects of statistical analysis in clinical trials, including the methods used, interpretation of results, and reporting of findings.
Methods:
The methods used in statistical analysis for clinical trials are designed to ensure valid and reliable results. Rigorous study designs, such as randomized controlled trials (RCTs), are commonly employed to minimize bias and confounding factors. Here are some commonly used methods/techniques in statistical analysis.
- Regression Analysis: Used to model and explore the relationship between a dependent variable and one or more independent variables. It helps identify the strength and direction of the relationship and can be used for prediction and understanding the impact of predictors on the outcome variable. Linear regression, logistic regression, and multiple regression are commonly used regression techniques.
- Analysis of Variance (ANOVA): ANOVA is a statistical method used to compare means across multiple groups or conditions. It determines if there are statistically significant differences between the means and identifies which groups are significantly different from each other.
- Time Series Analysis: Time series analysis examines patterns and trends in data collected over time. It involves methods such as autoregressive integrated moving average (ARIMA) models, exponential smoothing, and trend analysis. Time series analysis is often used in forecasting and understanding temporal patterns in data.
- Cluster Analysis: Cluster analysis is used to group similar objects or individuals based on their characteristics. It identifies clusters or segments within a dataset, helping to uncover patterns and similarities. Common clustering algorithms include hierarchical clustering and k-means clustering.
- Factor Analysis: Factor analysis is used to identify underlying factors or latent variables that explain the relationships among a set of observed variables. It helps reduce the complexity of the data and uncover the underlying structure. Factor analysis is commonly used in psychology, market research, and social sciences.
- Survival Analysis: Survival analysis is used to analyse time-to-event data, such as the time until an event occurs or the time until failure. It involves methods such as Kaplan-Meier estimation, Cox proportional hazards model, and log-rank test. Survival analysis is often used in medical research and studies involving time-to-event outcomes.
- Hypothesis Testing: Hypothesis testing is used to make statistical inferences about a population based on sample data. It involves formulating a null hypothesis (no effect or no difference) and an alternative hypothesis (effect or difference exists), collecting data, calculating a test statistic, and determining the probability (p-value) of obtaining the observed results. Common hypothesis tests include t-tests, chi-square tests, ANOVA, and regression analysis.
- Descriptive Statistics: Summarizes and describes the main features of a dataset. This includes measures of central tendency (e.g., mean, median, mode) and measures of variability (e.g., standard deviation, range, variance). Descriptive statistics provide a basic understanding of the data and help to identify patterns and trends.
Interpretation:
Interpretation involves making sense of the statistical results and drawing meaningful conclusions. It requires understanding the statistical tests used, the results obtained, and their implications in the context of the research question or hypothesis. It is important to avoid overinterpreting results or making causal claims when the study design cannot support them. Here are few examples of interpretation.
- Predictive Interpretation
- Causal Interpretation
- Exploratory Interpretation
Reporting:
Reporting involves communicating the findings of the statistical analysis in a clear and organized manner. It typically includes a written report, research paper, or scientific article. The reporting should follow established guidelines and standards. The report should provide an overview of the study, describe the methods employed, present the results in an understandable format (e.g., tables, figures), and discuss the interpretation and implications of the findings. It is essential to report both significant and non-significant results, as well as any limitations or potential sources of bias. Here are some examples of reporting categories in statistical analysis.
- Summary Statistics
- Tables and Figures
- Hypothesis Testing Results
- Model Fit Statistics
- Limitations and Assumptions
In conclusion, though complex, statistical analysis is a double-edged sword. If used appropriately, it can yield promising inferences for large-scale clinical applications. But if handled without appropriate statistical methods and interpretation, even a valid study can be nullified due to poor deciphering of the study’s statistical and clinical significance.
For more information –
Visit our website – www.paradigmit.com
Or you can write us at ask@paradigmit.com
Follow us for more – https://www.linkedin.com/company/paradigmittechnologyservices/?viewAsMember=true


