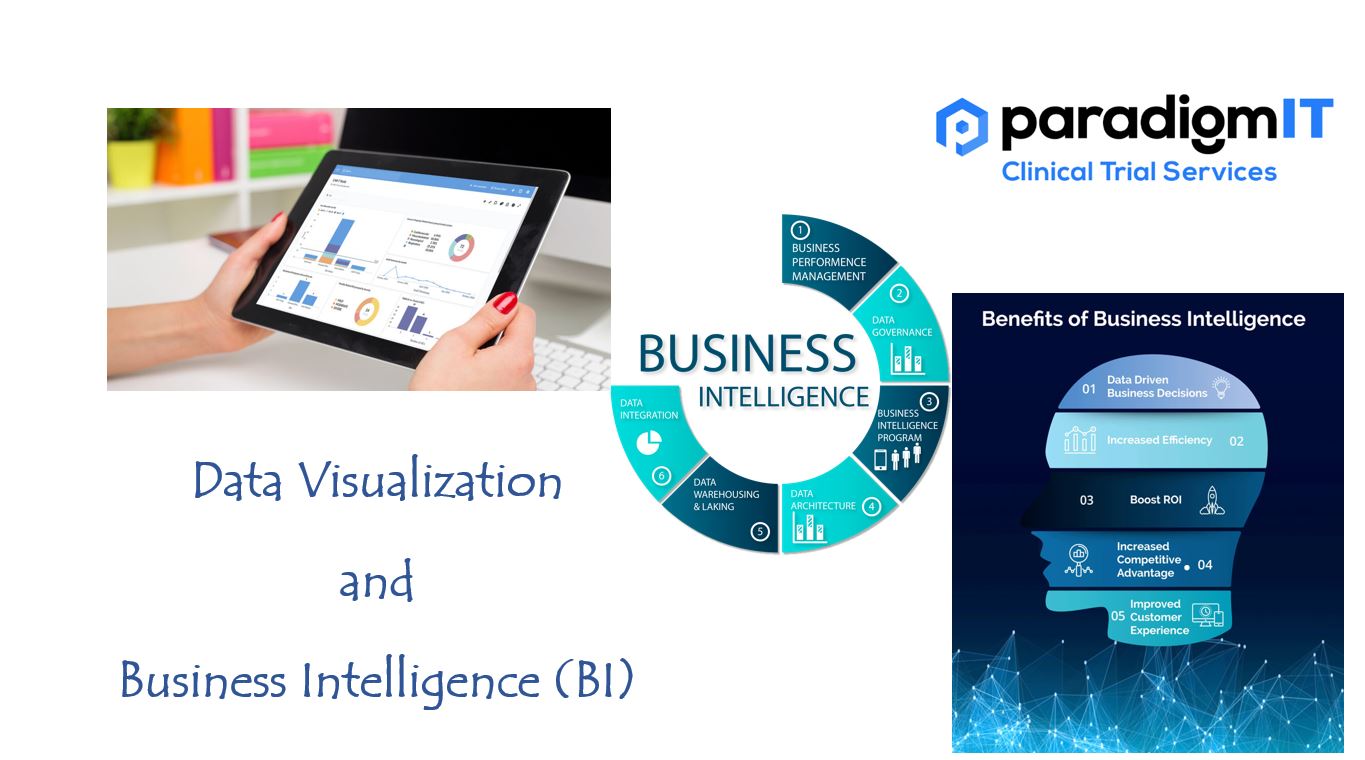
In the realm of clinical trials, Data Visualization and Business Intelligence (BI) have emerged as powerful tools, catalyzing informed decision-making and accelerating research outcomes. Data visualization and business intelligence (BI) are important techniques for increasing the efficiency and effectiveness of clinical studies. Data visualization can assist researchers in identifying trends, patterns, and outliers that would otherwise go unnoticed by translating complex data into simple graphics. The data can then be analyzed using BI to make educated decisions about trial design, patient recruitment, and data analysis.
Data visualization breaks down complex trial data into visual insights. Patient outcomes, adverse events, and efficacy trends are all visualized using interactive graphs, charts, and dashboards. This allows researchers to spot patterns, outliers, and connections quickly, allowing for proactive actions.
Business Intelligence is a broader concept that encompasses processes, technologies, and tools for collecting, analyzing, and presenting business data to aid the stakeholder decision-making. BI tools automate data integration from several sources, allowing for real-time access to trial metrics. BI aids in anticipating patient recruitment rates, optimizing resource allocation, and eliminating potential bottlenecks through predictive analytics. These findings promote adaptive trial design, which improves agility in responding to changing situations.
Here are some concrete instances of how data visualization and business intelligence (BI) are utilized in clinical trials:
- Identifying patient subgroups: By visualizing data on patient demographics, clinical characteristics, and outcomes, researchers can identify patient subgroups that are more likely to benefit from a particular treatment.
- Monitoring patient safety: BI can be used to track patient safety data in real-time, allowing researchers to identify and address potential problems early on.
- Optimizing trial design: Data visualization can be used to assess the efficiency of a clinical trial design and identify areas where it can be improved.
- Making data-driven decisions: BI can be used to analyze data from clinical trials to make informed decisions about treatment, patient management, and resource allocation.
- Protocol Compliance and Site Performance: BI dashboards can track site-level performance in adhering to the trial protocol and provide insights into deviations. These been depicted as compliance rates and highlight potential issues.
- Patient Retention Analysis: BI can analyze patient dropout rates and reasons for attrition, whereas Visualizations help in identifying common factors that lead to patient discontinuation.
- Regulatory Reporting: Visualizations can be used in regulatory submissions to convey trial results more effectively and BI systems can generate standardized reports required by regulatory authorities.
- Data Integration: BI tools can integrate data from multiple sources, such as electronic health records (EHRs), lab results, and patient-reported outcomes. These data are combined and presented in a coherent manner by Visualizations.
Data Visualization and BI also improve stakeholder communication. Clear visuals make it easier to communicate precisely how a trial is doing, fostering cooperation between researchers, sponsors, and regulatory agencies. Transparency speeds up decision-making and fosters trust among stakeholders in the therapeutic ecosystem.
Benefits of using data visualization and BI in clinical trials:
- Increased accuracy: BI can be used to analyze data in real-time, which can help to identify potential problems early on and prevent them from affecting the trial results.
- Enhanced decision-making: Data visualization and BI can help researchers to make better decisions about trial design, patient recruitment, and data analysis, which ultimately improves efficiency.
- Increased Patient recruitment and mitigating retention issues: Streamlined recruitment efforts and by identifying common reasons for patient attrition through data analysis and visualization, strategies can be developed to improve patient retention, reducing the need for additional recruitment efforts. thereby reducing the time and cost associated with enrollment.
- Improved patient care: By identifying patient subgroups that are more likely to benefit from a particular treatment, data visualization, and BI can help to improve patient care.
- Predictive Analytics: BI tools can use historical trial data to make predictions about patient outcomes, treatment responses, and adverse events, allowing researchers to proactively address potential issues.
- Data Transparency: Visualization makes it easier to communicate trial results and findings to a broader functional team, promoting transparency in clinical research.
In conclusion, the marriage of BI and data visualization enhances the efficacy of clinical studies. These solutions strengthen collaboration, improve resource utilization, and sharpen decision-making through visual insights and predictive analytics. Adopting these technologies opens the door for trials that are more effective, insightful, and significant as clinical research progresses.
For more information –
Visit our website – www.paradigmit.com
Or you can write us at ask@paradigmit.com
Follow us for more – https://www.linkedin.com/company/paradigmittechnologyservices/?viewAsMember=true


